A3.2 Classification & Cladistics
Higher Level
Introduction to Cladistics
Classification involves placing organisms in groups according to their traits or evolutionary origins. This allows scientists to store and retrieve the vast amount of knowledge accumulated about the biological world and organisms. The classification of organisms is often referred to as taxonomy.
Higher Level
Higher Level
Level of Classification
Each level in classification is referred to as a taxon.
Domain ⟶ Kingdom ⟶ Phylum ⟶ Class ⟶ Order ⟶ Family ⟶ Genus ⟶ Species
Higher Level
Higher Level
Higher Level
Conditions Of Classification
Classification mirrors evolutionary origins, so for the conditions of classification to be met:
-
Every organism that evolved from the same common ancestor must be classified under the same taxonomic level
-
In each taxonomic group, all species evolved from a common ancestor, should have synapomorphies (traits that evolved in the most common ancestor and is shared amongst all organisms in each taxonomic group)
Higher Level
Higher Level
Cladograms
A cladogram is a branching diagram that illustrates ancestral and descendant relationships among organisms. It is structured using roots, nodes, and clades.
-
A clade is a group of organisms that share a common ancestor.
-
Cladistics uses DNA and amino acid sequences to determine evolutionary relationships. While classification was traditionally based on morphology, modern taxonomy increasingly relies on genetic data for greater accuracy.
-
The time of divergence between species can be estimated by analyzing the number of differences in their DNA or protein sequences — more differences generally indicate a more distant common ancestor.

Higher Level
Application
Describe how cladistics helps determine evolutionary relationships between organisms.
Cladistics traces evolutionary relationships by analyzing DNA and amino acid sequences to identify shared ancestry. The fewer the differences in these sequences between two species, the more recently they are believed to have diverged. Additionally, the more traits organisms share, the more likely they evolved from a common ancestor, and the closer they appear together on a cladogram.
Application
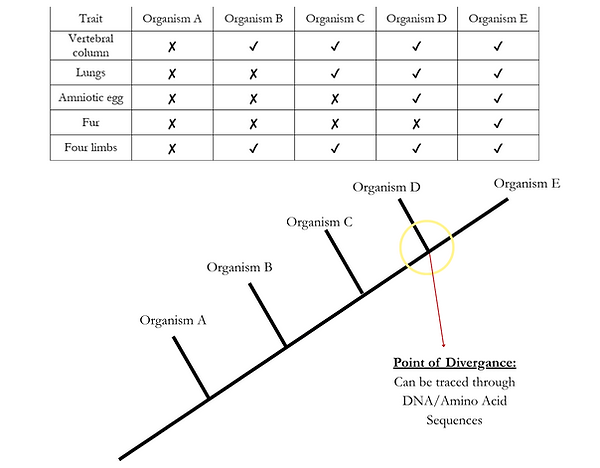
The table below shows the presence (✔) or absence (✘) of five traits in five different organisms.
Using the data below, draw a cladogram to show the evolutionary relationships between the five organisms. Include all traits as branching points and label the organisms at the ends of the branches.